Your comments
I'm not sure if I've understood this correctly. We've tried drawing the pipe using polygons and mesh from WPF 3D to define each "pixels" color, but the performance was not great. Is the PipeVisual3D in fact a meshbuilder, that simplifies drawing of pipes?
One thing I did not mention before was that the data set we receive is processed with bilinear interpolation, to give a nicer view.
We are not familiar with the term hit test. To get the 3D-coordinate on a MouseDown we used this event:
A lot of questions appear for me, some of which may not be fitting, but please know that all help is very much appreciated!
Below is an example picture from a bitmap representation of one measurement, after and before interpolation (the matrix is about 12 times the size of the original):

ps, that button can do all kinds of things!
One thing I did not mention before was that the data set we receive is processed with bilinear interpolation, to give a nicer view.
- When drawing the pipe with the Helix toolkit, are we able to extract coordinates on the model? In a way using the model itself as a coordinate system to plot the different color values directly to the model with a brush? I am not sure if we need to use linear gradient brush, as the resolution of the matrix is good enough after the interpolation I mentioned.
- The pipe has the same dimensions as the bitmap, it is as long as the bitmap is wide and has a radius which is the bitmap height divided by 2 * pi. When translating a 3D-coordinate from a MouseDown event in the viewport the Y-coordinates will be the same on in both viewport and bitmap. To get the height-coordinate in the bitmap, we used the following method:
public static double GetRow(double x, double z, Measurement m) {
            double
                    noRows = m.WallLossMatrix.rows,
                    radius = noRows / (Math.PI * 2);

            if (z >= 0) {   // First and second quadrant
                if (x >= 0) {   // First quadrant
                    return Math.Asin(x / radius) * radius;
                }
                else {   // Second quadrant
                    return (2 * Math.PI - Math.Asin(-x / radius)) * radius;
                }
            }
            else {   // Third and fourth quadrant
                if (x < 0) {   // Third quadrant
                    return (Math.PI - Math.Asin(x / radius)) * radius;
                }
                else {   // Fourth quadrant
                    return (Math.PI - Math.Asin(x / radius)) * radius;
                }
            }
        }
We are not familiar with the term hit test. To get the 3D-coordinate on a MouseDown we used this event:
private void hViewport_MouseDown(object sender, MouseButtonEventArgs e) {
            var pt = hViewport.FindNearestPoint(e.GetPosition(hViewport));
            if (pt.HasValue) {
                (...)
            }
        }
Is this hit testing, or is there a better way?A lot of questions appear for me, some of which may not be fitting, but please know that all help is very much appreciated!
Below is an example picture from a bitmap representation of one measurement, after and before interpolation (the matrix is about 12 times the size of the original):
ps, that button can do all kinds of things!
Alright, thank you.
Thank you for your reply.
I've now read the link you sent me. I recently purchased a book called WPF 4.5 Unleashed, which has been very helpful and also touches on this topic. This seems like what we need.
I understand that we will be using hit testing to recognize where the clicks are performed, and if it is of importance regarding our program layout. We are, by the way, strictly using Helix/WPF for 3D-purposes, as well as Oxyplot for the charting bit.
I do not understand what you mean by creating a linear interpolation to interpret the hit test results.
If I were to click the 2D bitmap, and wanted the same point to be marked on the 3D model corresponding with the .bmp, is this where the interpolation is necessary?
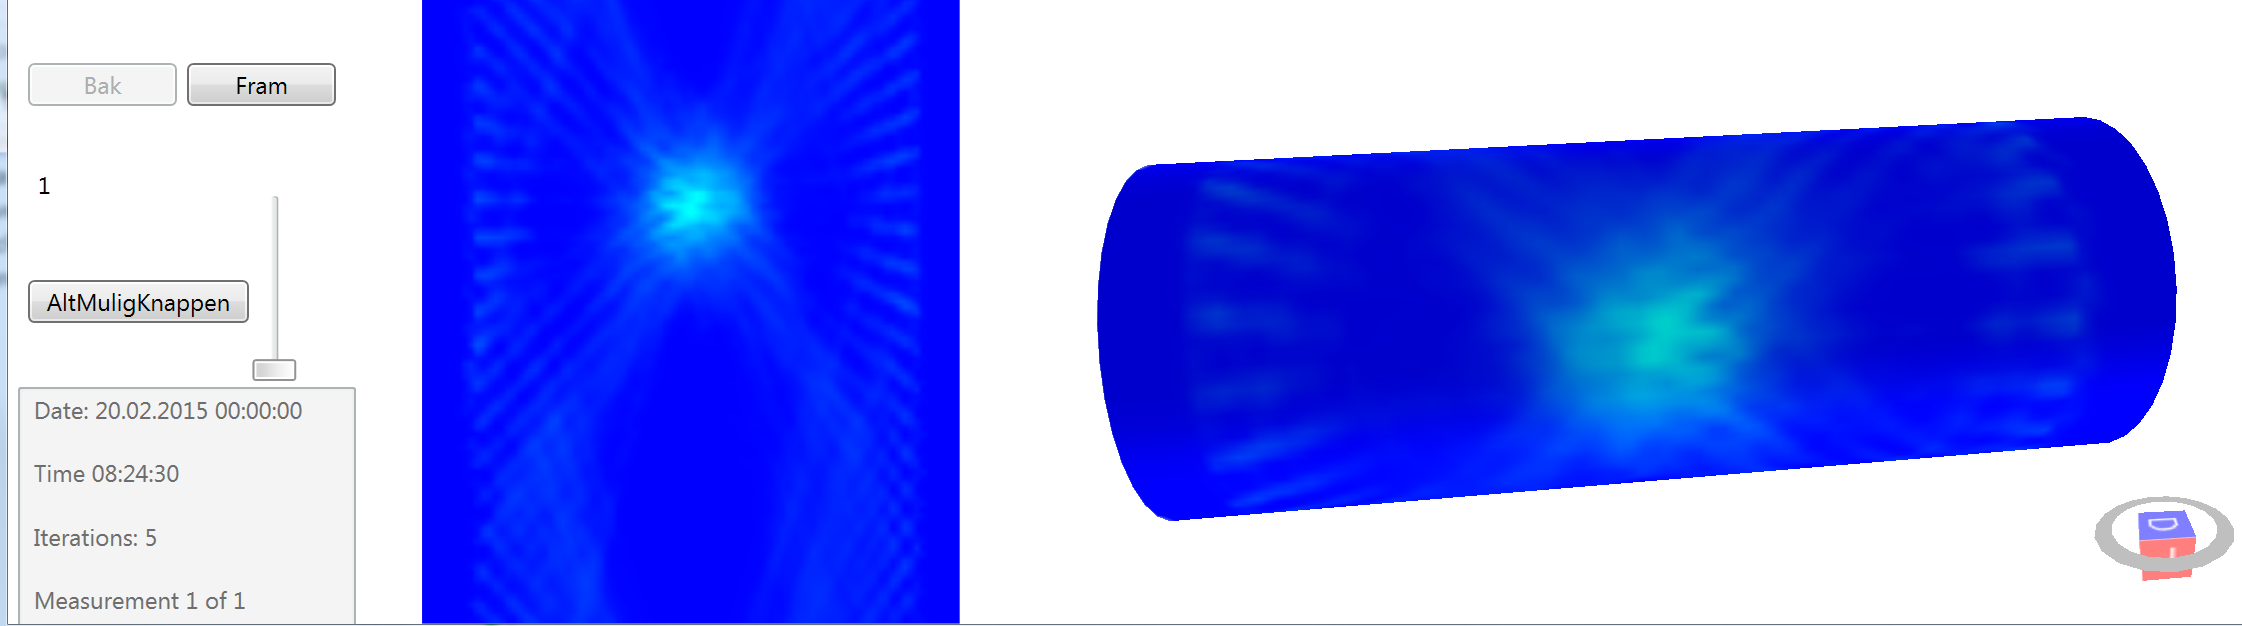
Beneath is an early version (before MVVM) where you can see the 2D and 3D representation. The 2D is a Image object/BitmapSource, and the 3D model is a Pipe3D (Helix) with the bitmap wrapped around it, in a HelixViewport3D.
I've now read the link you sent me. I recently purchased a book called WPF 4.5 Unleashed, which has been very helpful and also touches on this topic. This seems like what we need.
I understand that we will be using hit testing to recognize where the clicks are performed, and if it is of importance regarding our program layout. We are, by the way, strictly using Helix/WPF for 3D-purposes, as well as Oxyplot for the charting bit.
I do not understand what you mean by creating a linear interpolation to interpret the hit test results.
If I were to click the 2D bitmap, and wanted the same point to be marked on the 3D model corresponding with the .bmp, is this where the interpolation is necessary?
Beneath is an early version (before MVVM) where you can see the 2D and 3D representation. The 2D is a Image object/BitmapSource, and the 3D model is a Pipe3D (Helix) with the bitmap wrapped around it, in a HelixViewport3D.
Customer support service by UserEcho


After some testing with your example, and reading up on texture coordinates, we are now more familiar with what your example does.
When hit testing we can get the texture coordinates from the point that has been clicked. The question now is how to map these coordinates on the model so that they correspond to actual "pixels" and values from the measurement matrices, and how to build the pipemodel correctly.
The next thing is to map all the "pixels" color values onto the pipemodel, giving a good visual representation of the data.
After looking at the SurfacePlot example we can get an idea of how this is done, but we are unsure how to translate this to fit in with our task. We want to implement this functionality in our program, and also the meshgrid lines, which can be a helpful visual in our case. Do you know of any simpler examples on how to do this, or is this already a simple example?
So, to clarify:
Thinking about it, what we're actually asking is how do we combine the functionality between the two examples you've mentioned?
Ideally, we would have to get the hits from two triangles, that specify one pixel/measurement value. I think we should be able to figure this one out.
Again, please ask should anything be unclear.